
GitHub contribution graph generator: an honest comparison
A GitHub contribution graph generator is any tool that helps you produce a pattern of green squares on your profile. Some only help you plan and visualize a design; others script backdated commits to fake activity. This guide compares manual planning, commit generators, and the honest plan-and-track approach, so you can choose the one you will be proud of.
Three ways to build a contribution graph
You sketch a pattern on paper or in a spreadsheet and try to line it up with real commit days yourself.
Upside: free, honest, no tools needed.
Downside: tedious, error-prone alignment, no reminders, easy to lose track over a long design.
Scripts that write empty commits with backdated timestamps to draw a pattern instantly.
Upside: fast, produces any shape in minutes.
Downside: the activity is fake. It misrepresents your work, offers no real skill or habit, and does not hold up to scrutiny.
Design a pattern visually, get a day-by-day schedule, and complete it with genuine contributions plus reminders.
Upside: honest result, builds a real consistency habit, tracks progress and streaks.
Downside: takes real time — the graph fills as you actually do the work.
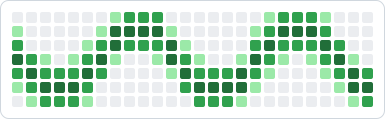
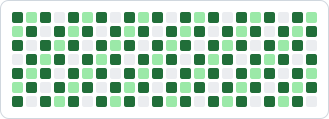
Feature comparison
The three approaches optimize for different things. Manual planning optimizes for honesty but leaves you doing fiddly date math with no safety net. Commit generators optimize for speed at the cost of everything that makes the graph mean anything. The plan-and-track approach tries to keep the honesty of manual work while removing the tedium — mapping your design to exact dates, reminding you before deadlines, and tracking progress so a long pattern never quietly falls apart. Read the table across each row to see where each option genuinely helps and where it leaves you exposed.
| Capability | Manual | Generator | Graphex |
|---|---|---|---|
| Visual planning of the patternGraphex paints on a grid that mirrors your real graph. | |||
| Maps design to real calendar datesTurns a picture into a day-by-day schedule. | |||
| Uses genuine contributionsGenerators typically script empty, backdated commits. | |||
| Reminders so you do not miss a dayEmail and push reminders before scheduled days. | |||
| Streak and progress trackingDashboard shows your run and what is next. | |||
| Honest, terms-friendly resultNo fabricated activity involved. |
full · partial · not supported
Why we built a planner instead of a generator
Writing a commit generator would have been the easy path. We deliberately did not, because a graph made of hollow commits is worth nothing the moment anyone looks past the thumbnail — and it teaches you nothing. The interesting problem is not drawing a shape in seconds; it is turning a design goal into a sustainable habit of real contribution.
So Graphex focuses on the parts that are genuinely hard: translating a picture into exact calendar dates, keeping you aware of which day needs coverage, and reminding you before you miss it. The commits stay yours. The graph fills at the pace of your actual work, which means the finished pattern is also an honest record of showing up. If you want to understand the craft side, the guide on making art on your contribution graph walks through how the grid maps to dates, and the streak tracking guide covers how to keep the run alive.
If your goal is a graph you can point to with a clear conscience, the plan-and-track approach is the one that survives a second look.
Frequently asked questions
Is a GitHub contribution graph generator against the rules?
It depends on what the generator does. Tools that only help you plan and visualize a pattern are fine. Tools that script large numbers of empty, backdated commits to fabricate activity misrepresent your work and run against the spirit of GitHub — we recommend avoiding them.
What is the difference between a generator and a planner?
A commit generator produces the commits for you, usually empty ones with fake dates. A planner, like Graphex, shows you which days to contribute on and reminds you, but leaves the actual contributions to your genuine work. One fakes the graph; the other guides real activity.
Can I get an artistic graph without faking commits?
Yes. Plan a pattern in a visual editor, then complete it with real commits, pull requests, reviews, and documentation scheduled onto the right days. It takes longer than a script, but the result is honest and the consistency habit is worth more than the picture.